


1Clauses 6.1.2 and 9.1.3 e)
A live heat map that shows your risks move
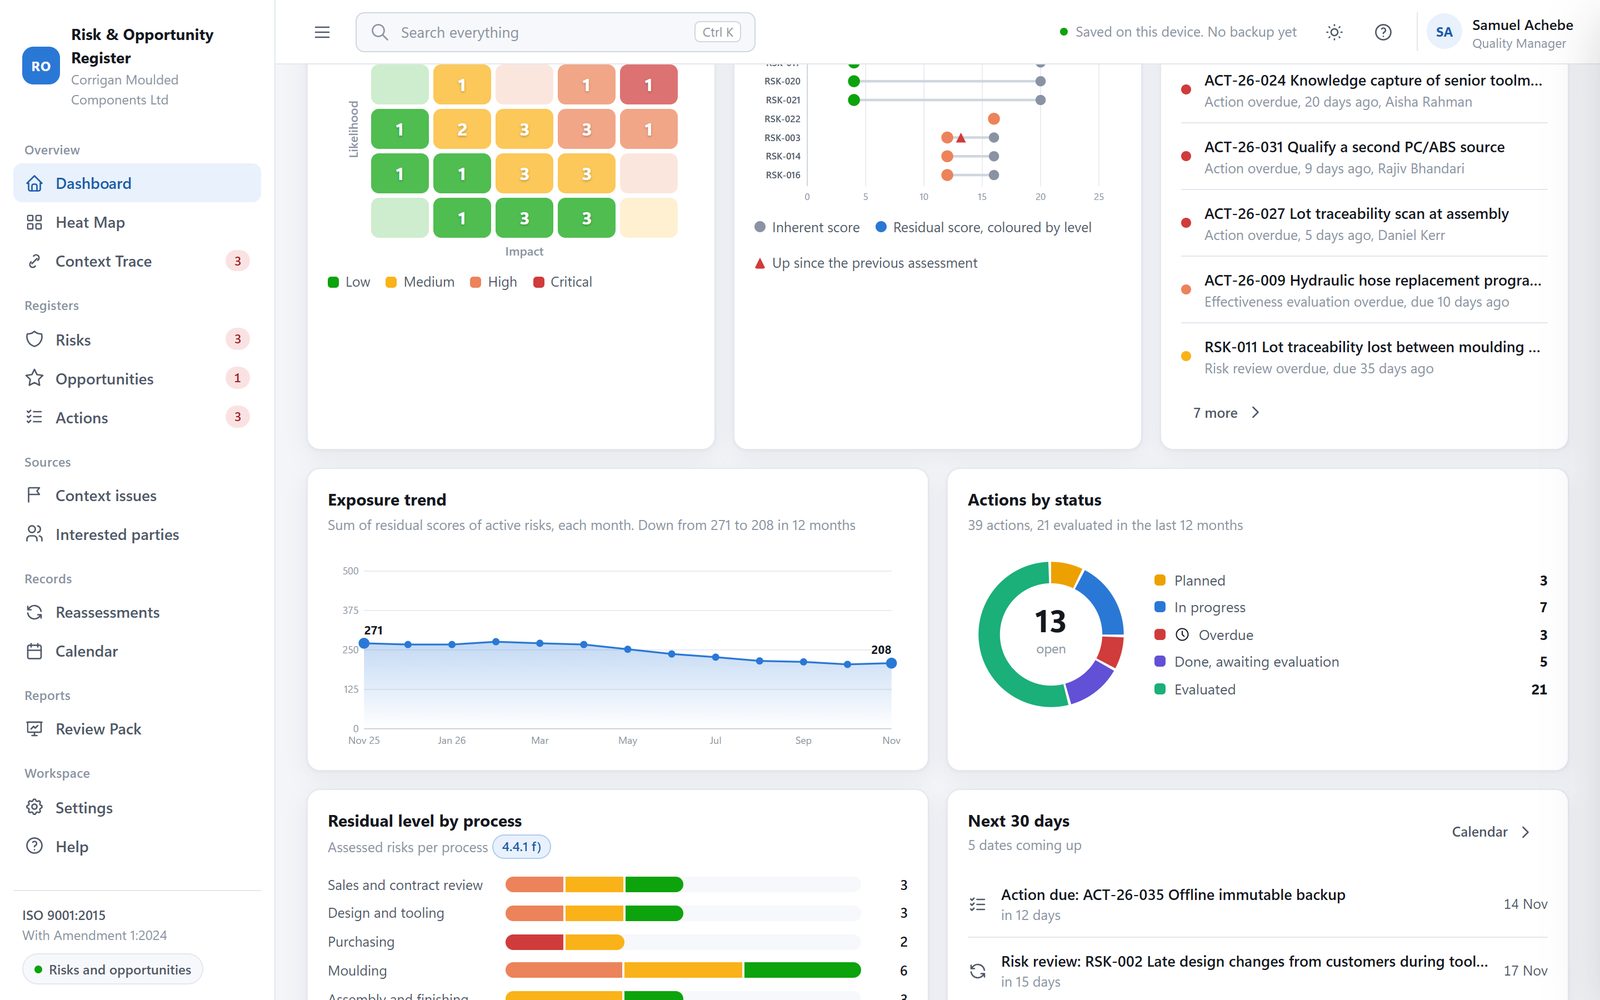
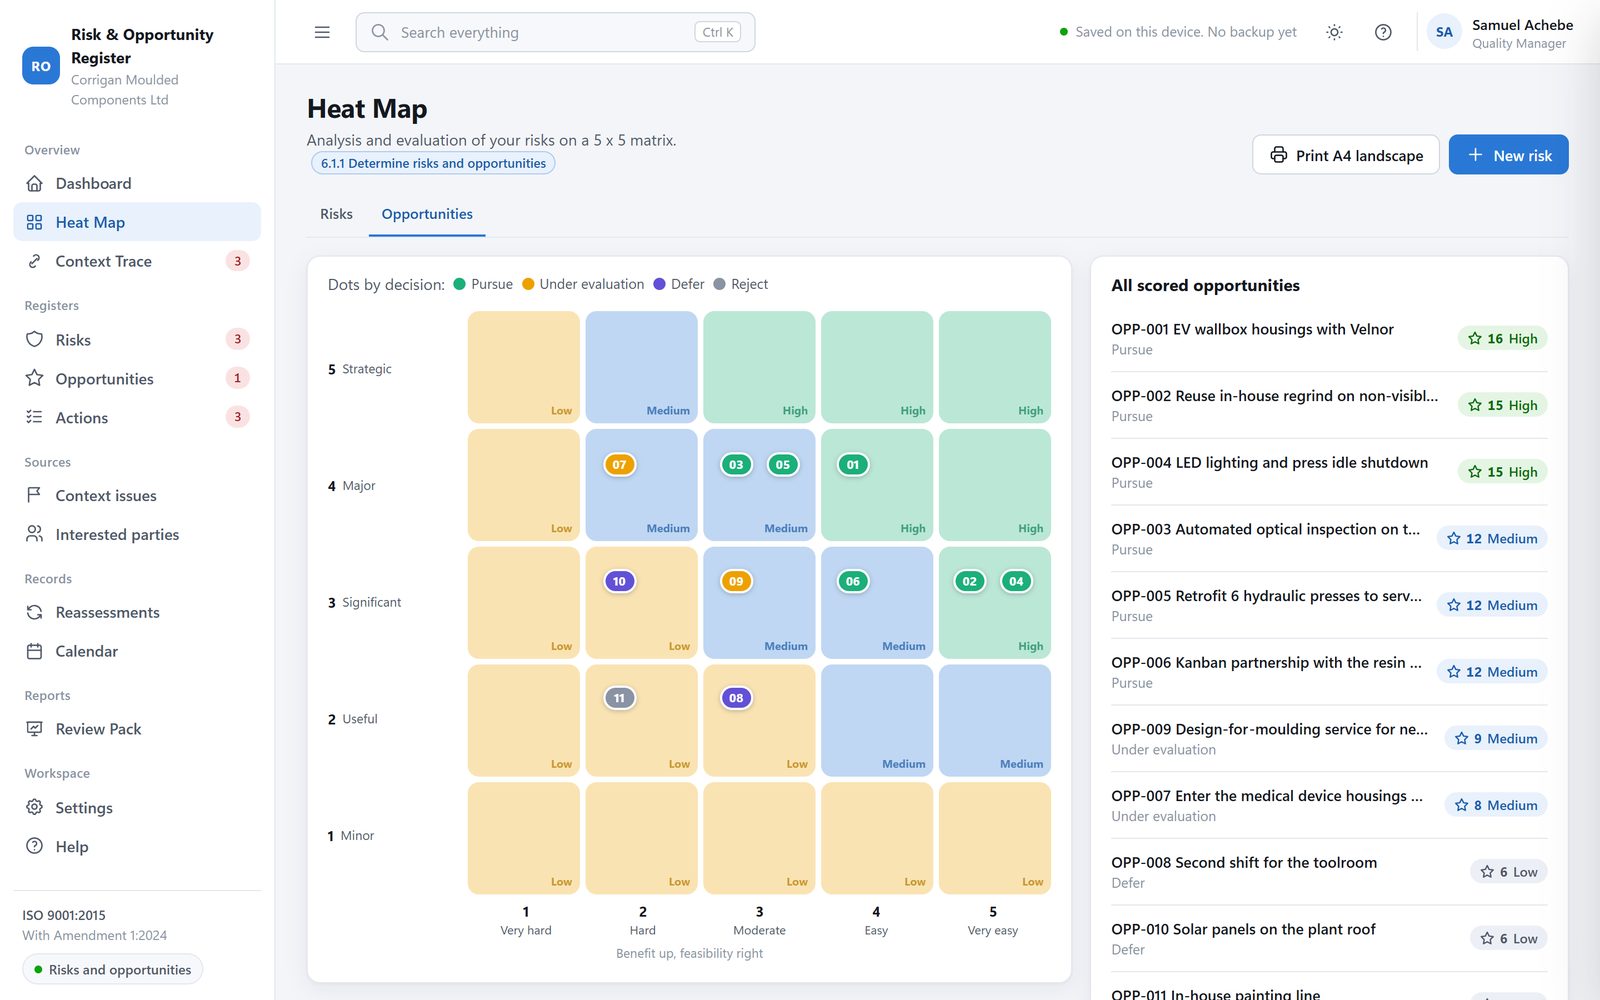
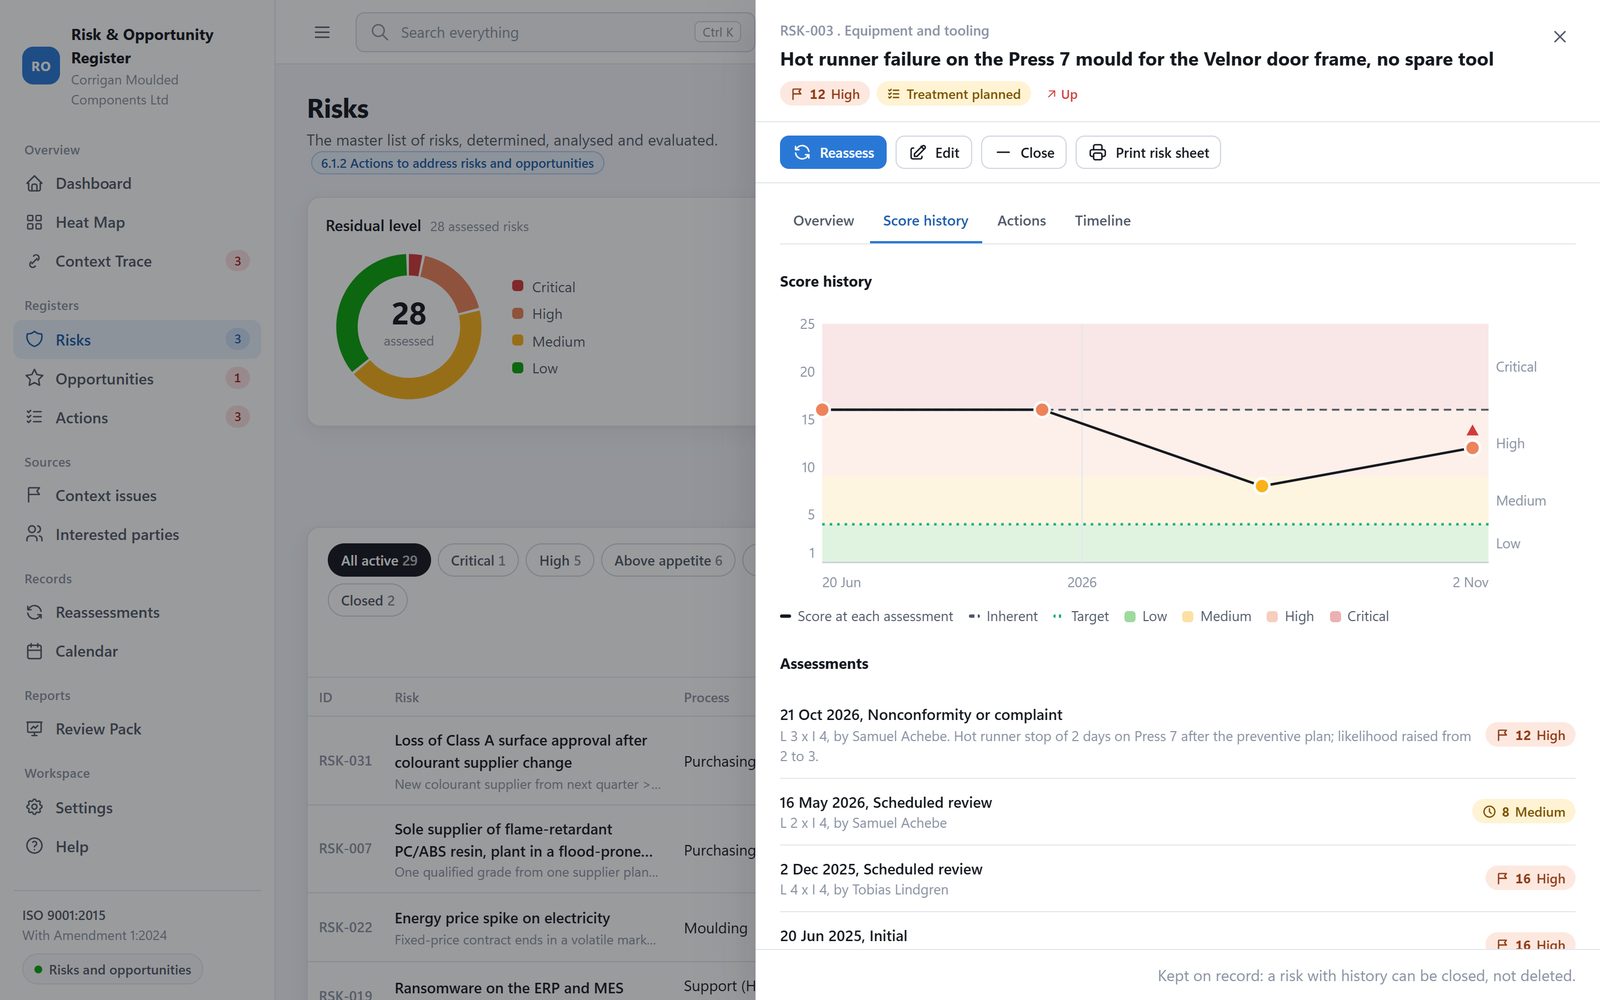
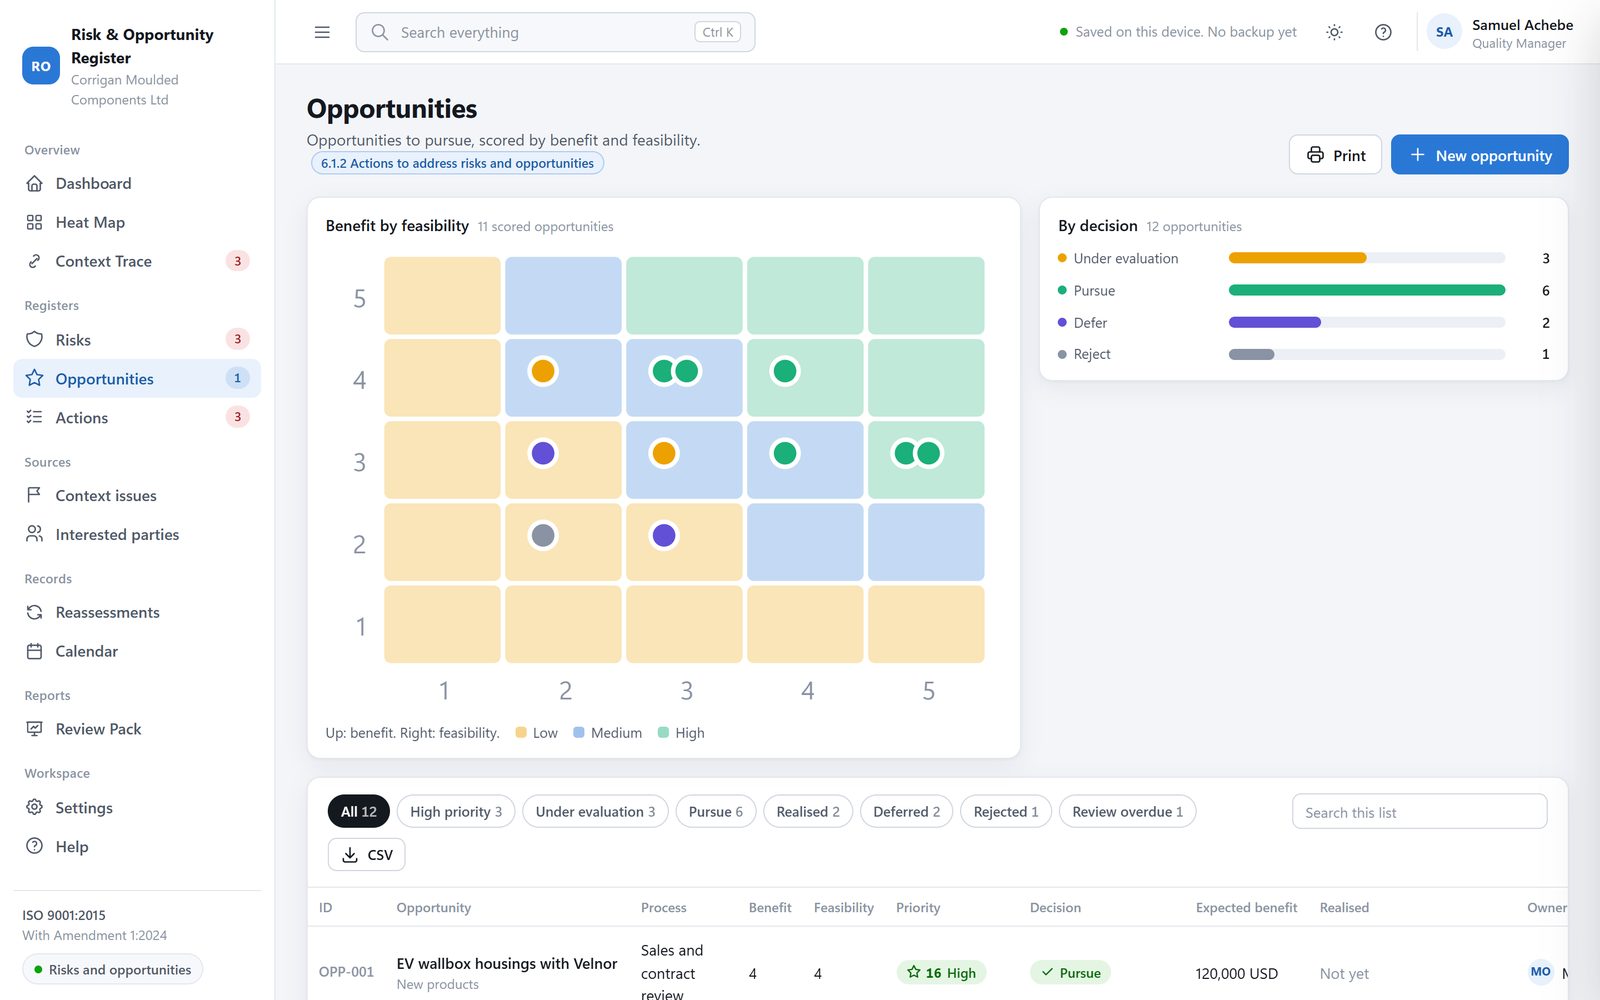
Every risk is a dot on a 5x5 likelihood and impact matrix. Switch between Inherent, Residual and Target and the dots move to their new cells. "Show movement" draws an arrow from the inherent to the residual cell of each risk, in red when a risk went up. Click a cell to list its risks. A second tab places your opportunities on a benefit and feasibility matrix. Thresholds and cell levels come from your Settings.